

Best Application Performance Monitoring (APM) Tools in 2026: Datadog vs New Relic vs Dynatrace vs Grafana Cloud vs Sentry
When a web app slows down, the first question is always the same: where is the time going? It could be a slow database query, a third-party API that’s timing out, a memory leak after the last deploy, or one region of your cloud provider having a bad day. Application performance monitoring (APM) tools answer…

Photo by Domaintechnik on Unsplash
When a web app slows down, the first question is always the same: where is the time going? It could be a slow database query, a third-party API that’s timing out, a memory leak after the last deploy, or one region of your cloud provider having a bad day. Application performance monitoring (APM) tools answer that by tracing each request through your code and services, so you can see the slow step instead of guessing.
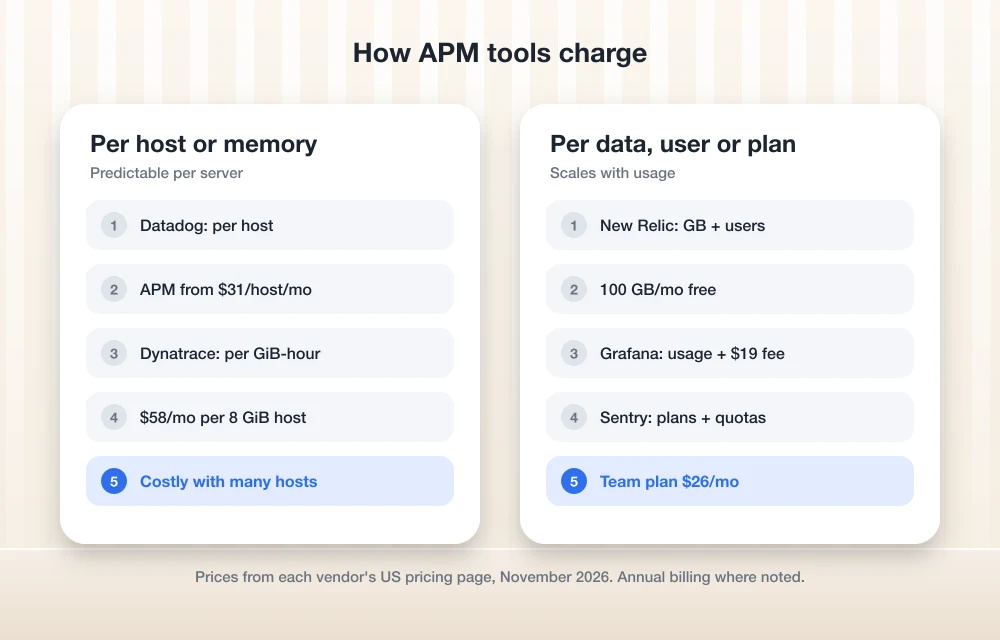
The hard part isn’t finding an APM tool. It’s picking one whose pricing model won’t surprise you three months in. Datadog charges per host, New Relic per user and per gigabyte, Dynatrace per memory-hour, Grafana Cloud per usage, and Sentry per plan with event quotas. This guide compares the five on pricing, free tiers and OpenTelemetry support, using each vendor’s own pricing pages.
What to look for before you sign up
- Distributed tracing: Can it follow one request across your web server, background workers, database and external APIs?
- OpenTelemetry (OTel) support: OTel is the open standard for traces, metrics and logs. If you instrument with OTel, you can switch vendors later without rewriting code. The OpenTelemetry vendor list shows all five tools below accepting OTLP data natively.
- The billing unit: Hosts, users, gigabytes, events or memory-hours. The right model depends on whether you have many small containers, a few big servers, or a large team that all needs access.
- Retention: How long traces and metrics stay searchable on the plan you can afford.
- Error tracking and logs: Some tools bundle these, others charge separately.
The best APM tools in 2026
1. Datadog APM
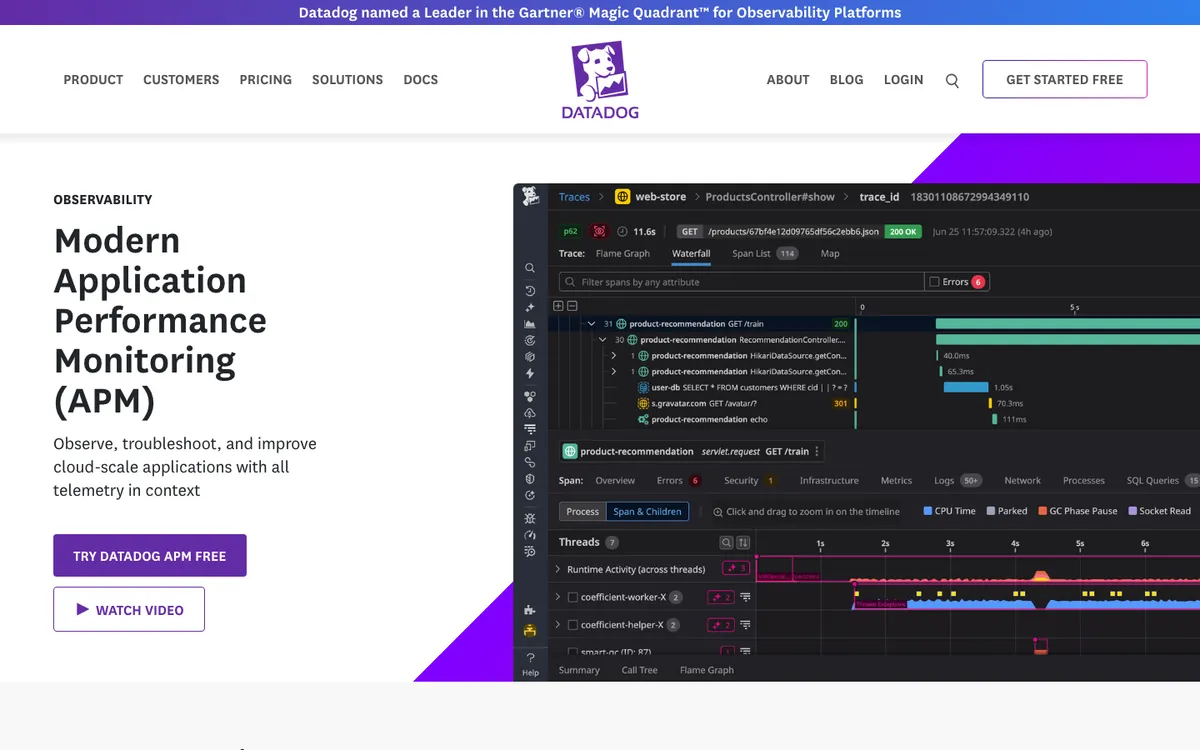
Datadog is the one-console option. APM, infrastructure metrics, logs, real user monitoring and security all live in the same product, so a slow request can be lined up against the host CPU graph and the log lines from the same minute. On its pricing page, Datadog lists APM at $31 per host per month billed annually when Infrastructure Monitoring is attached ($36 on demand), with APM Pro at $35 and APM Enterprise at $40. Infrastructure Pro adds $15 per host per month billed annually.
So a realistic starting point is around $46 per host per month for APM plus infrastructure on annual billing, before logs. Per-host billing is predictable when you run a handful of servers and gets expensive when you scale out to many small ones. After a free trial, Datadog’s Free tier covers up to five Basic hosts with one-day metric retention, which is fine for a look around but not a substitute for paid APM.
Best for: Teams that want APM, infrastructure and logs in a single tool and can budget per host.
2. New Relic
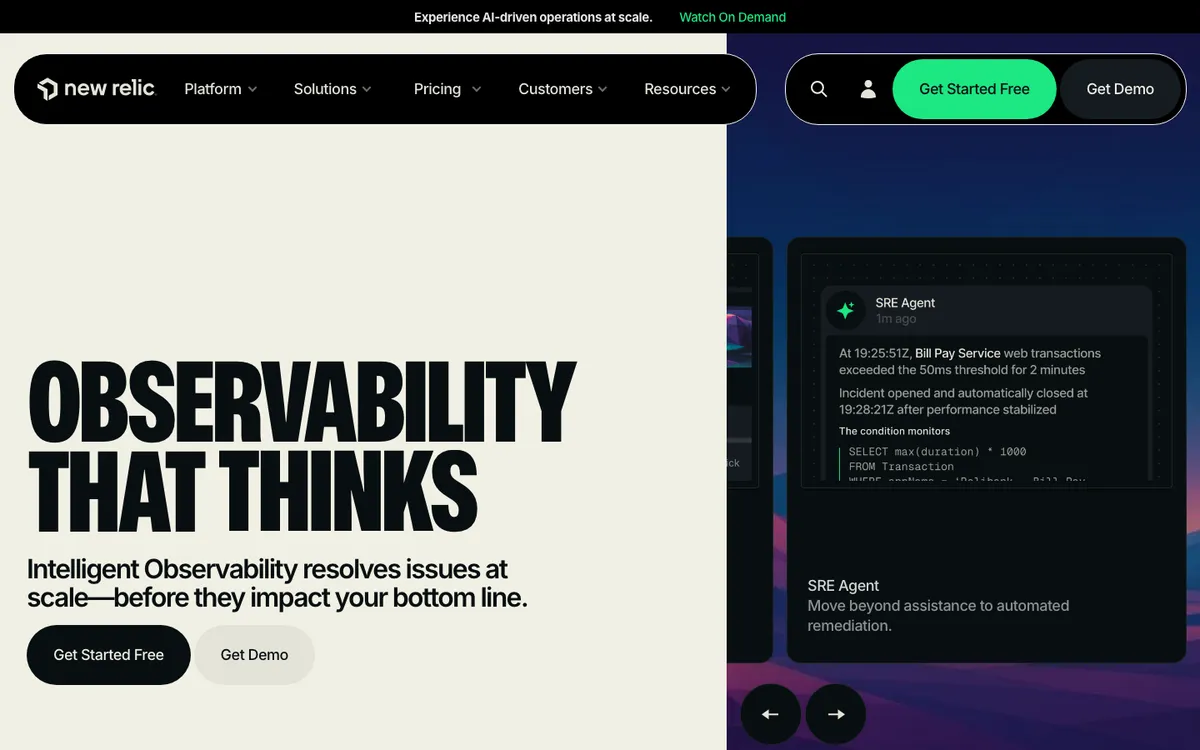
New Relic doesn’t charge per host at all. Its pricing has two parts: data ingested and users. The Free tier includes 100 GB of data ingest per month, one full platform user, unlimited basic users and 500 synthetic checks. Beyond 100 GB, data costs $0.40 per GB on the original data option or $0.60 per GB on Data Plus.
Users are where the bill grows. On the Standard plan, the first full platform user is $10 and each additional user is $99, up to five. The Pro plan lists $349 per full user per month with an annual commitment. That makes New Relic very cheap for a solo developer or a small team where only one or two engineers need full access, and less so for a large team that all wants to dig into traces.
Best for: Small teams with lots of hosts or containers but only a few people who need full access.
3. Dynatrace
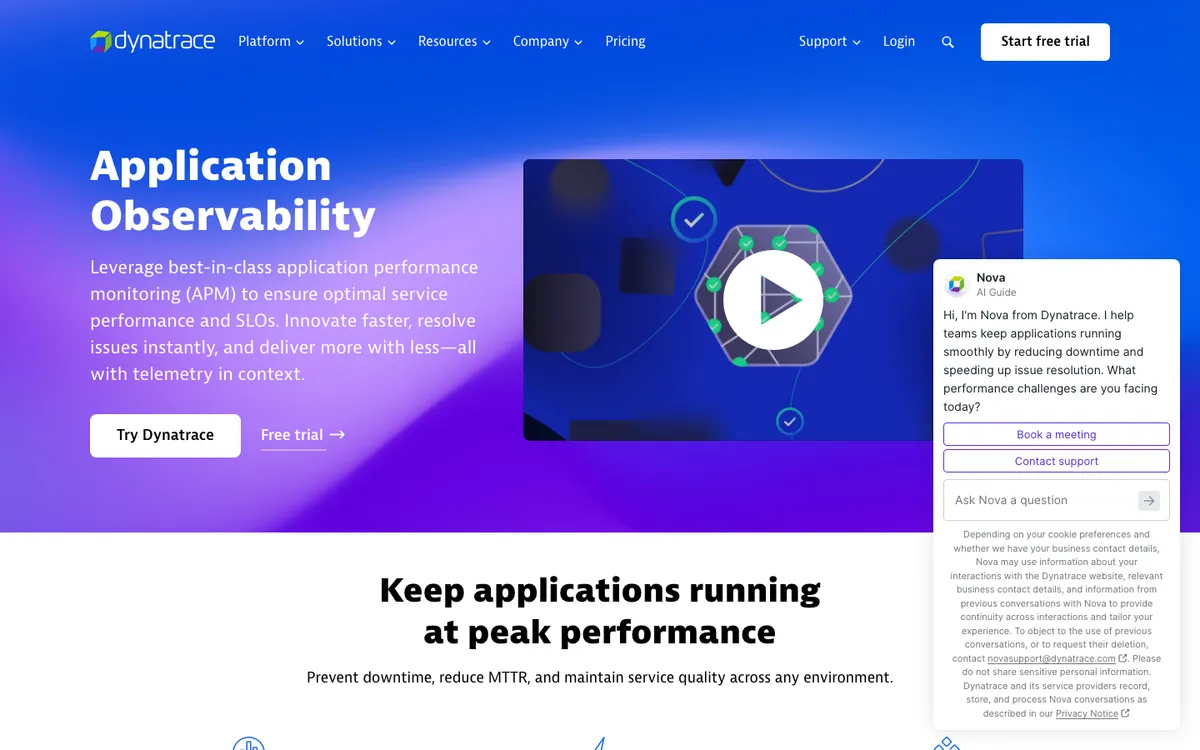
Dynatrace leans hardest into automation. Its OneAgent discovers services and dependencies on its own, and its AI engine aims to point at a root cause rather than just raising alerts. Dynatrace’s rate card lists Full-Stack Monitoring at $58 per month per 8 GiB host, billed at $0.01 per memory-GiB-hour, and Infrastructure Monitoring at $29 per month per host. There’s a 15-day free trial.
The memory-based billing is worth thinking through: a 32 GiB server costs four times an 8 GiB one, while lots of small containers can stay cheap. Dynatrace is usually a better fit for mid-size and larger environments than for a two-person startup.
Best for: Larger or fast-changing environments where automatic discovery and root-cause analysis save engineering time.
4. Grafana Cloud
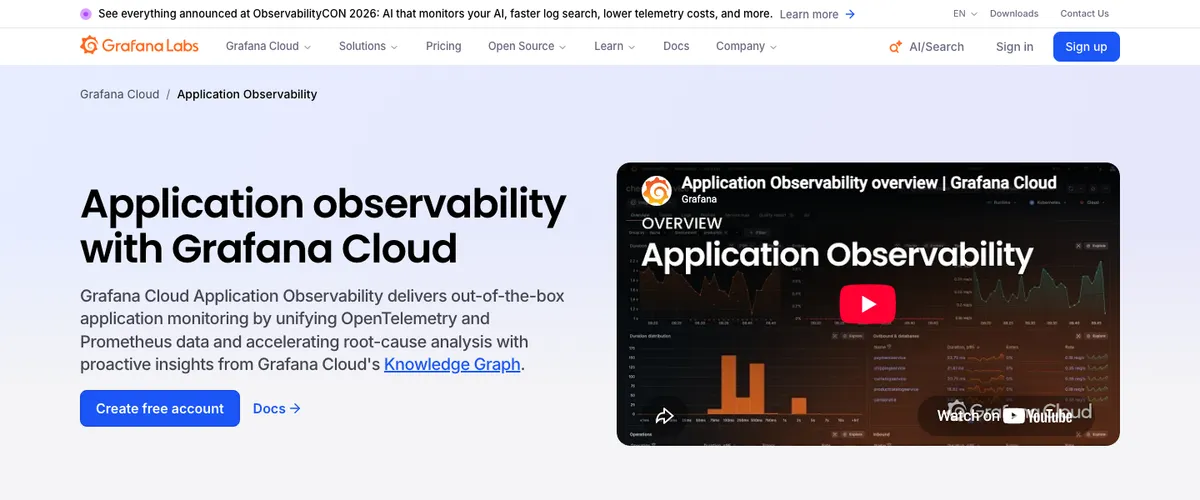
Grafana Cloud is built on open-source projects (Grafana, Prometheus-compatible metrics, Loki for logs and Tempo for traces), which appeals to teams that already use them or want to avoid lock-in. The Free tier is generous: 10,000 active metric series, 50 GB of logs and 50 GB of traces per month, each with 14 days of retention, plus three visualization users.
The Pro tier starts with a $19 monthly platform fee and then charges by usage. Grafana lists its Application Observability product at $0.025 per host hour (about $18 per host per month), metrics at $6.50 per 1,000 series, and traces and logs at $0.05 per GB processed, $0.40 per GB written and $0.10 per GB retained. Pro also extends trace retention to 30 days.
Best for: Teams comfortable with open-source tooling who want a strong free tier and usage-based pricing.
5. Sentry
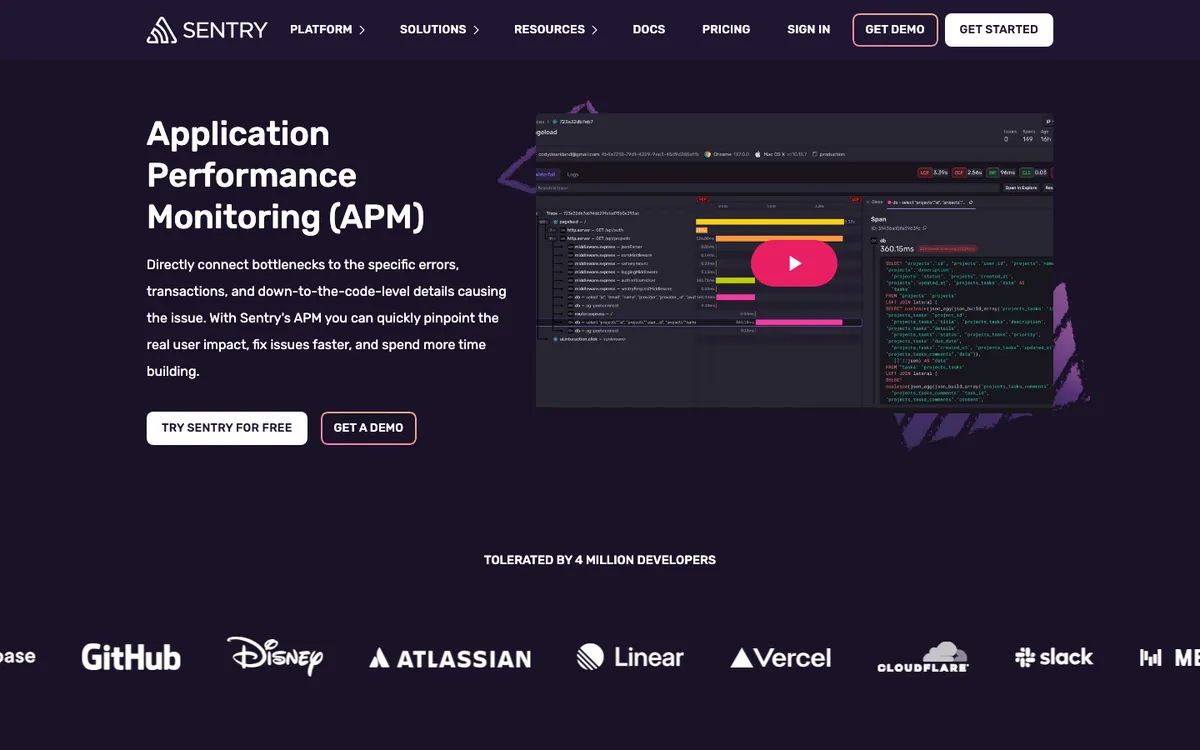
Sentry started as an error tracker and is still the most developer-focused tool here. It ties slow transactions and errors back to the exact release and line of code, and it adds session replay so you can see what the user did before a crash. Sentry’s Developer plan is free for one user with 5,000 errors, 5 million tracing spans and 50 session replays. The Team plan is $26 per month billed annually ($29 monthly) and the Business plan is $80 per month billed annually ($89 monthly), both with unlimited users.
Sentry isn’t a full infrastructure monitoring platform, so you’d usually pair it with something for host metrics. For front-end and mobile apps, though, its error-plus-performance view is hard to beat at that price.
Best for: Developers who care most about errors, slow transactions and releases, especially in web front ends and mobile apps.
Pricing and free tiers compared
| Tool | Billing model | Free option | Paid starting point |
|---|---|---|---|
| Datadog | Per host | Free tier for up to 5 infrastructure hosts; trial for APM | APM $31/host/month (annual, with Infrastructure) |
| New Relic | Data (GB) plus users | 100 GB/month, 1 full user | $0.40/GB after 100 GB; Standard users $10 then $99 |
| Dynatrace | Memory-GiB-hour | 15-day trial | $58/month per 8 GiB host (Full-Stack) |
| Grafana Cloud | Usage plus platform fee | 50 GB traces, 50 GB logs, 10k series | $19/month platform fee plus usage |
| Sentry | Plan plus event quotas | Developer plan, 1 user | Team $26/month (annual) |
Prices above are from each vendor’s US pricing page and exclude taxes and add-ons such as log management or extra events.
Which APM tool fits your setup
- A side project or an early startup: Grafana Cloud Free or New Relic Free will cover you for a long time. Add Sentry Developer for front-end errors.
- A Node.js or Python app on a few servers: Datadog’s per-host model is easy to forecast. If you’ve just moved to a new runtime, tracing will also show which dependencies broke, as in our guide to fixing Node.js errors after upgrading to Node 26.
- Kubernetes with many small pods: Per-host pricing can climb quickly, so compare New Relic’s data-based model and Grafana’s usage model against Datadog’s.
- A larger company with complex dependencies: Dynatrace’s automatic discovery is designed for that scale.
Whichever you pick, instrument with OpenTelemetry where you can. It keeps the decision reversible if prices change or your needs grow.
Don’t forget the hosting underneath
APM often reveals that the problem isn’t your code at all but an undersized server or a noisy neighbor on shared hosting. If your traces keep pointing at the platform, our guides to the best web hosting for small business websites and cloud hosting providers for performance and security are a good next read.
FAQs
What is the best free APM tool?
Grafana Cloud Free (50 GB of traces a month with 14-day retention) and New Relic Free (100 GB of data a month and one full user) are the most generous. Sentry’s free Developer plan is a good fit for a single developer focused on errors and slow transactions.
How much does Datadog APM cost?
Datadog lists APM at $31 per host per month billed annually when combined with Infrastructure Monitoring, or $36 on demand. Infrastructure Pro is an extra $15 per host per month billed annually.
Do these APM tools support OpenTelemetry?
Yes. Datadog, New Relic, Dynatrace, Grafana Labs and Sentry are all listed on the OpenTelemetry project’s vendor page as supporting OTLP natively.
Is APM the same as infrastructure monitoring?
No. Infrastructure monitoring tracks servers and containers (CPU, memory, disk), while APM traces requests through your application code and services. Most teams use both, and several vendors sell them together.
Disclosure: TheTechHacker has no paid relationship with Datadog, New Relic, Dynatrace, Grafana Labs, Sentry or any company mentioned here. Prices come from each vendor’s official pricing page in November 2026 and can change.
Featured image: Domaintechnik on Unsplash.
You might also like

Best Exchange Server Monitoring Software and Tools for 2019
Microsoft Exchange Server is a popular solution to all your email problems. It is the most widely used email server in the world. Emails are an integral part of any company or organization, for it represents the way of professional & confidential communication between two parties. It is essential to monitor and maintain this infrastructure.…

SQLBak – Freely Backup, Restore or Monitor SQL Server Database With Easy
Yes with easy!! SQL Server database is the backbone of any business that helps you make better business decisions and track performance.
Top 5 Cloud Hosting Providers for Performance & Security
Choosing a good cloud host is essential to having fast response times and consistent uptime, as well as being able to secure your data and resources reliably. This list contains 5 of the best options for 2026 that balance all of these needs. Cloud hosting provides more flexibility than shared hosting in terms of resource…
The week in tech, minus the noise.
New reviews, fixes and the stories that matter — once a week, straight to your inbox.
We only use your email to send the newsletter. Unsubscribe any time. See our privacy policy.
Comments